
Trends From Analyzing Every Pre-Seed & Seed Round Since 2010
Part I

65,475 pre-seed and seed funding rounds have been announced in the US since 2010.
This data, enriched with unicorn, exit, and fund formation data, reveal how much things have changed over the past decade. Over the following weeks, we will publish our findings in a visual format. Some may be intuitive & obvious, while others might serve as a surprise.
Let's start with the obvious.
(We’ve also included notes at the bottom regarding our process and methodology)
Trend 1
The Growth of Seed and the Emergence of Pre-Seed
Since 2010, Venture has added a new term to its lexicon: pre-seed. Many in the ecosystem, however, still lump pre-seed and seed into one monolithic term: “Seed”, and the difference between the two is often seen as nebulous.
Though these two rounds have both been used to describe the initial rounds of funding for a startup, the failure to analyze the two rounds separately begets missing the stark difference in trends across each. As we’ll see, Pre-seed has cemented itself as its own class and has taken a distinct path relative to the traditional seed round.

*Chart shows the multiple of growth across respective stages since 2010. There’s a link below for the data if you are interested.
Seed rounds (pre-seed and seed) have grown faster than any other stage in venture. 2010 yielded 1,383 startups that raised seed funding which has since ballooned to 8,000+ in 2021 (when seed hit its peak). Growth financing comes in at a distant second with 2.5x respective growth across Series D and Es.
Examining the growth behind seed rounds reveals some interesting findings, though.

Despite the rampant collective growth, when isolating the traditional “seed” round, we find that its contribution has been minimal since 2013. The number of financings labeled as “seed” has been choppy at best since 2013 and largely static.
The amount of capital deployed, however, has risen dramatically.
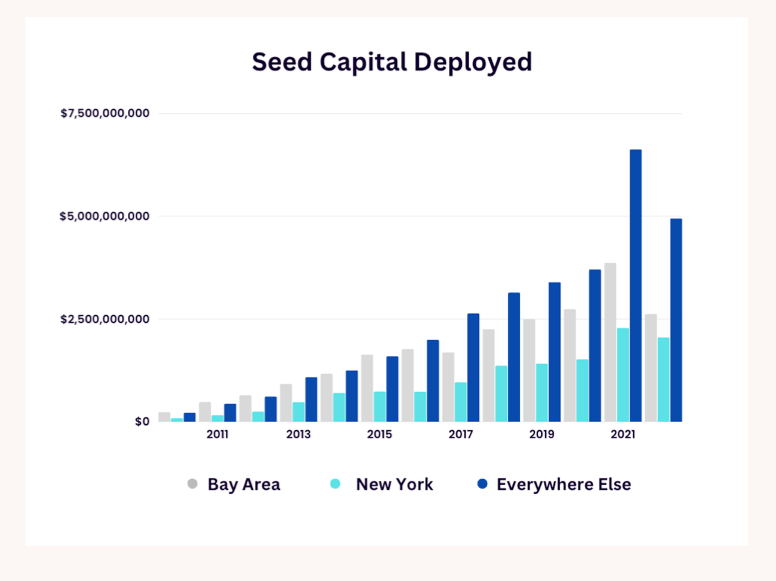
~$500M was allocated to seed in 2010, a figure that has shrunk to 4% of what was deployed in 2021. With the quantity of rounds holding relatively constant and the output of dollars increasing rapidly, this alludes to dramatic growth in the sizes of these rounds.

We will dive into round sizes across geographies in a subsequent article, but the chart above of Bay Area seed rounds highlights how large seeds have gotten. Not only have the rounds grown significantly larger, but the delta between the top and bottom quartiles has widened.
—
Before pre-seed becoming popularized, startups often needed to raise two seed rounds to get to product market fit and warrant a Series A. Tom Tunguz noticed this in 2015 and coined this the “double seed”. The double seed has since been re-categorized to pre-seed and seed.
The difference between the two is often nebulous for many founders, so I asked my friend Aaron Michel at 1984 Venture to describe how he thinks about the difference.
Aaron: The way I think about them is that, from a product perspective, pre-seed ranges from pre-product to having an MVP/early product. From a commercial perspective, the company is usually pre-launch or very recently launched and likely has fairly little revenue. Seed rounds, on the other hand, have a product, some customers/design partners, (usually) revenue, and hopefully early signs of product/market fit.
For those that haven’t found a successful startup before or have an especially strong background for the company that they’re starting (driving the willingness to pay across investors), pre-seed has become the initial round of funding, not seed.
The growth in these rounds has been dramatic, especially in geographies outside the Valley and New York City.

It’s been so dramatic that if we bifurcate our initial chart into pre-seed and seed, the growth rate of pre-seed dwarfs all other stages.

*Chart shows the multiple of growth across respective stages since 2010 with pre-seed and seed delineated. Here is a link to the data across all funding rounds.
Despite the current macroeconomic headwinds in 2023, evaluating the data with a broader lens underscores how fertile the fundraising environment has become for early-stage founders since 2010. Venture has materialized as a mainstream asset class, and the supply of capital has increased dramatically from all angles.

In subsequent posts, we’ll dig deeper into how round sizes have trended across geographies and take a closer look at graduation rates, exits, and unicorn yields.
Notes
Crunchbase served as the primary data source for funding announcements, exit, and fund formation.
Stages were delineated using the “Funding Type” field in Crunchbase.
Funding rounds less than $1M can be difficult to capture, given that many angel/pre-seed rounds are not reported.
This is especially true for rounds raised in the past year or so. Oftentimes, initial rounds of financing on SAFEs or notes will be reported until the company raises its first equity financing. More accurate number for 2022 will be available as time progresses.
Many of the exits do not have a publicly reported acquisition amount which limited the insights that we could collect from them.